
Congressman Johnson may be concerned about the increasing population on Guam causing the island to tip over, but has population increase had interesting consequences for one of the island’s weather stations?
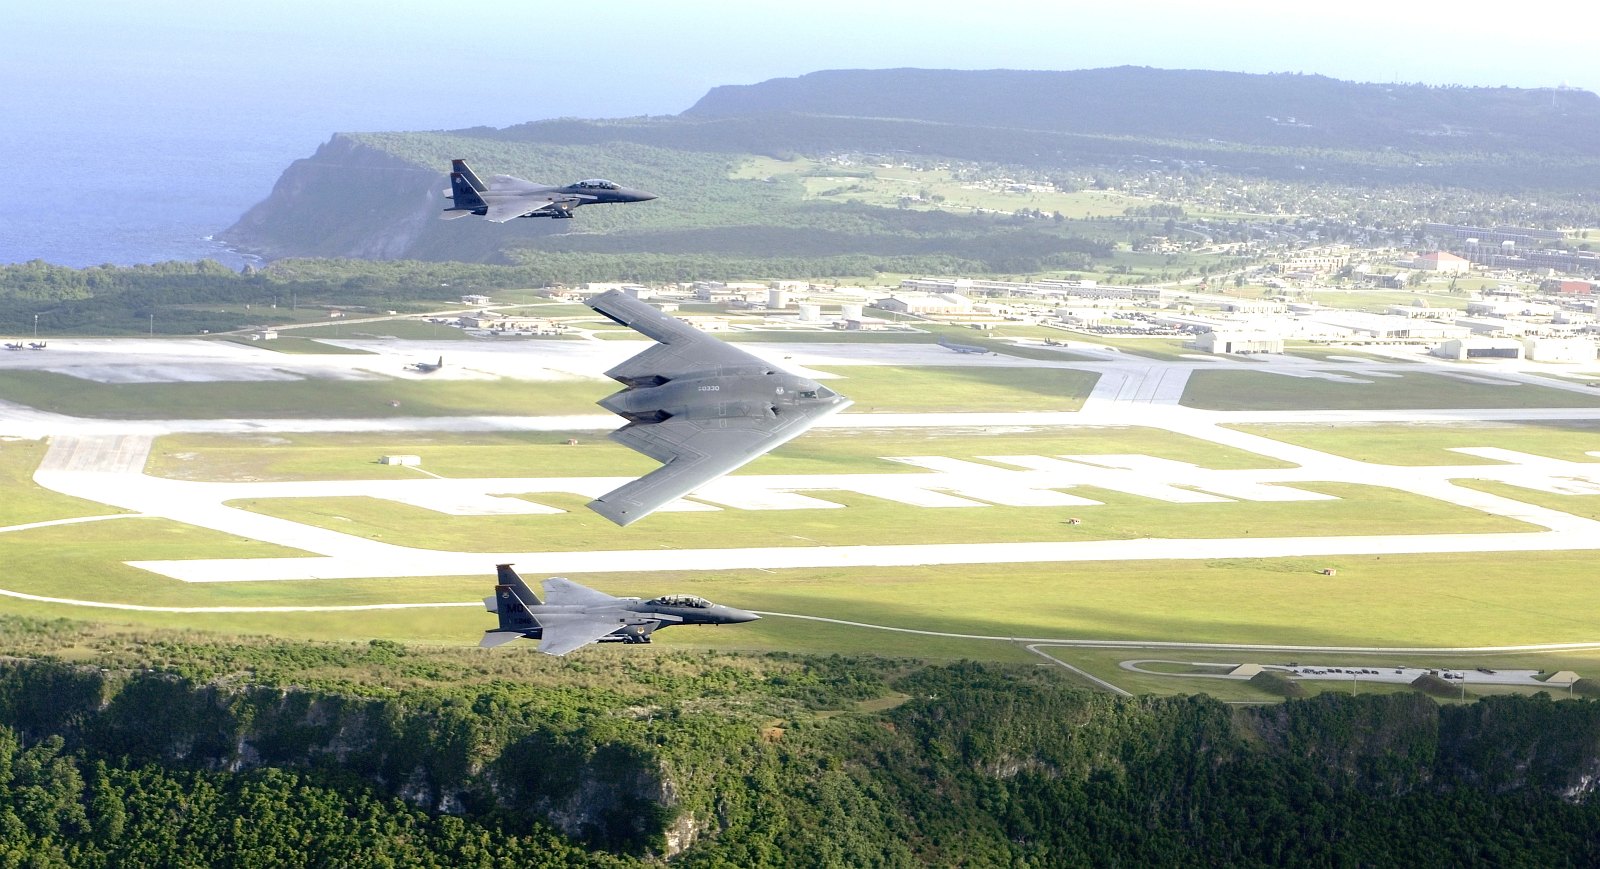
Andersen Airforce Base, Guam (original here)
There are three stations for Guam in the GHCN data file: Andersen AFB; NWSO Agana and WSMO Agana. For such a small island three weather stations, all in similar topography on the northern part of the island, would be expected to show very good correlation, after all they are within 10 miles of each other, but one shows a very large and sudden warming during the1990s.
These are the stations from GISS Station Data:
Nwso Agana, G 13.5N 144.8E (WMO id 91212) Rural area 1921 – 2010
Wsmo Agana, G 13.6N 144.8E (WMO id 91217) Rural area 1956 – 2004
Andersen Afb, 13.6N 144.9E (WMO id 91218) Rural area 1949 – 1981
 As these are all classified as rural stations, they are not adjusted. NWSO Agana is located at the busy international airport, seen in the picture on the right just inland from the capital, Hagatna, at night. [I wonder what the new nightlights analysis being used by GISS will make of this? Hmm I might check and update here later]. Andersen Airforce Base is in the northeast of the island, but WSMO Agana was hard to find initially due to the very approximate latitudes and longitudes in the GISS station data.
Here is what the three temperature records look like when plotted together:

For Andersen Afb and NWSO Agana there are variations of just over a degree, and there is obviously a discrepancy between them in how the local topography responds to climate. Also, these are airports so there may be human influences there. However, that is one hell of a rise in WSMO Agana. How can you get that much warming at one of three such close stations in such a short period? Did no-one notice? I thought a lot of the checking that is done of the climate record is supposed to pick up and throw out “outliers”? OK, perhaps that is just the odd month or the odd year. This has intrigued me for a while. That cannot be normal and it certainly isn’t caused by CO2. Time to do some digging…..
Guam is located in the western North Pacific Ocean, the largest and furthest south island of the chain of volcanic islands that comprise the Mariana archipelago. The island is oriented northeast-southwest, about 20 miles long, 8-12 miles wide and covers an area of 209 square miles. The southern region is mountainous, with eleven peaks rising to 1,000 feet or more that form a discontinuous ridge that extends along the southwestern part. The northern region is a relatively flat limestone plateau, with steep coastal cliffs and narrow coastal plains that dominate this part of the island. The topography of this plateau gently undulates between elevations of 200 to 600 feet. Guam has a tropical climate, with year-round warm weather, a dry and a wet season, and moderate to high humidity. Seasonal temperatures vary approximately 5°F (2.7°C), with an annual average maximum temperature of 86°F (30°C) and an annual average annual minimum temperature of 76°F (24.5°C). The range of temperature between day and night is approximately 15-20°F (1).
OK Nice background, how what about those weather stations? Well Andersen Afb was easy to find and it wasn’t too hard to find out that NWSO Agana was at the International Airport. The NCDC Station Locator has this to say about WSMO Agana (and provided a more precise latitude/longitude):
“The National Weather Service station on Guam is located on the western side of the northern plateau. The ocean is l l/2 miles to the west, 9 miles to the north and east, and 5 miles to the southeast. The weather instruments at the station are well exposed in the center of an open field that is 40 acres in area. The trade winds reach the station after rising sharply up the 500-foot cliffs on the eastern side of the island and flowing 9 miles on an easy downslope grade across the surface of the northern plateau.”
Sounds good. I also found it through the Western Regional Climate Center. Here it is (pity about the cloud):

Looks rural enough. What could have caused that rise in temperature? So I started to read up about Guam.
I started this a while back and it has been like doing a very big jigsaw – you know one of those several 1000 piece ones you get at Christmas that sits on the dining room table for weeks until you have the patience to finish it; either you eventually get fed up with it taking up space or you invite friends for dinner and it has to go back in the box. It still amazes me how much information you can find on the internet. I have come to like Guam – I really feel I know the place now and have a real hankering to go there some day, but I digress…


I looked at topography:
Perhaps there has been vegetation clearance around WSMO Agana, and/or a lot of encroachment of urban areas and buildings. I found that the population of Dededo, for example, increased by 40% from 31,728 to 44,716 between 1990 and 2002 (1 – Table 4.1).
I looked in more detail into the weather:
Wind speed and direction varies with Guam’s two seasons. The wet season lasts typically from June to December and is characterized by a high relative humidity averaging 86% and weak southeasterly or southerly winds. The dry season generally lasts from December to June and is characterized by a low average relative humidity of 71% and “trade winds” from the northeast. So the station seems to be downwind of an increasing urban area in both seasons – could that be it?
And then I found another reason…..

Look at that -17 stations in total! But what I failed to notice at first on the NCDC site – the end date for WSMO Agana: 2nd April 1998. NCDC concurs. Quick – scroll back up to that graph again. Yup – data for WSMO Agana up to 2004. How can this be? FILLED in DATA?
Now the WWRC also had data for these three stations, although it said “last updated 2006”. There was a good fit with what I had pulled off the GISS site (at the end of November) – the data originating in the NCDC GHCN data file. I just plotted what I found and there are minor discrepancies granted, but it is the gaps I was interested in:

In the WRCC data, Andersen Afb continues reporting until 2002, with rising temperatures; WMSO Agana stops reporting in 1997 (as it should); there is no gap for NWSO Agana, but that fits reasonably closely with the post-1997 WMSO Agana data. So in the GHCN/GISS data NWSO Agana stops reporting for a while, but the data seems to be spliced into another station. Interesting. So what? Well the implications only become clear when you realise what this does to the temperature anomalies. The following graph shows the effect:

Look at that hockey stick – wow! This gives a sustained 1.5 degree anomaly for Guam for nearly a decade. And that is what drew my attention to it in the first place – a hot spot on the GISS anomaly map.

The thing is, an anomaly like this does not just affect a discrete location, it affects at least a grid square on the global map and is extrapolated into other grid squares too. Here’s how GIStemp sees this area:


Here is what the anomaly data looks like for the stations in this area (note that Koror (Palau) and Truk (Chuuk) are over a 1000km from Guam). WSMO Agana still sticks up like a sore thumb:

Here is how it looks in terms of the data plotted for the Guam grid cell after it has been through GIStemp (this is Step 3, with which I have very little familiarity as yet – try here at E.M.Smith’s blog for further information):


The stations contributing to this gridcell are: NWSO Agana; WSMO Agana; Andersen Afb; Truk; Falalop Island; Saipan. Likewise the three stations on Guam contribute to surrounding gridcells, which depending on the smoothing radius, can be up to 1200km away. There are 55 such gridcells. Taking WSMO Agana data out of the gridcell anomaly calculation makes a large difference to many of the cells, principally in 1998 and 1999 when the data for Yap and Truk shows a low anomaly value. Here is a table of data for the eight grid squares surrounding Guam, for which the maximum anomaly increase due to the WSMO Agana data has been calculated:

No wonder there is a nice hot spot around Guam on anomaly maps. Actually I should say not “is” but “was”, because I found a few weeks ago that all three Guam stations are no longer available from the “after Homogeneity Adjustment” version of the GISS station data web page. This should mean they are no longer part of the GISS adjusted data set and should therefore not contribute to the output of GIStemp – anomaly maps and global mean surface temperature etc. I did consider abandoning the work I had done for this post in the light of this, however I decided to post it anyway in the hope it contributes to others’ understanding, as it has to mine.
References
1. Guam Hazard Mitigation Plan (2005) Section 4.0 Island Description
2. Guam Hazard Mitigation Plan (2005) Section 5.0 Risk Assessment (Figure 5-12. Airport and Ports Map)
Acknowledgement
Thanks to Peter O’Neill for the GIStemp files, plots and general useful discussions.


佩璇佩璇 your comment has been deleted because of the links.
Note on comment deletion policy – deletions to date on this blog have only been due to unsavory links.
I was in the USAF and deployed to Guam in the mid 50’s. As I remember, Agana was little more than a village at that time. I can’t imagine an airport there at all. I was told that the only house on the island that had glass in the windows was the Governor’s house, and looking around that seemed very reasonable to believe.
In short, when Guam later became a tourist magnet, the growth – and urban warming – must have been phenomenal.
Rod Smith
@Rod Smith, that’s really interesting and fits with the first anomaly graph (I was too lazy to number them this time) – you can see a gradual rise in NWSO Agana from 1950 to the mid 1980s. The aiport website has a good timeline also: http://guamairport.com/index.php?pg=the-airport/timeline
Both NWSO Agana and Andersen Afb show cooling after that (natural climatic cooling despite urban influences?) while WSMO Agana gets warmer until it closes in 1997.
I’ve been fascinated looking at all these islands on Google Earth. Beautiful places. With the Earth City Lights overlay, Guam and Saipan are really bright, although the others mentioned are quite dark.
Sir: Are you aware of Rota International Airport (PGRO), on Rota Island, about 50 miles NNE of Agana International? They reported in METAR code, at least in 2008, but I have absolutely no idea how long they have been in operation. There is also a remote ROTA site with no ICAO call sign (COOP stn?) listed by NCDC.
This info may or may not be of any interest/value to you.
Rod,
Thanks found it:
http://www.wrcc.dri.edu/inventory/sodpi.html
914800 03 MP ROTA ROTA 19560101 19790731 14 08 00 145 09 00 49
914800 03 MP ROTA ROTA 19800701 19821001 14 08 00 145 09 00 47
914801 03 MP ROTA ROTA AP 19820201 19930601 14 10 00 145 15 00 588
914801 03 MP ROTA ROTA AP 19930601 19980204 14 10 00 145 15 00 588
914801 03 MP ROTA ROTA AP 19980204 20050816 14 10 18 145 14 34 588
914801 03 MP ROTA ROTA AP 20050816 20071002 14 10 18 145 14 34 588
914801 03 MP ROTA ROTA AP 20071002 99991231 14 10 18 145 14 34 588
data to 2009 here: http://www.wrcc.dri.edu/cgi-bin/cliMAIN.pl?pi4801 (scroll down to Monthly Temperature listings (Annual Average – 1993-2009 varies between 79.47F (2009) and 81.90F (2004) – looks pretty flat to me).
Verity
A “Gistemp status” update for you. Based on the night time radiance criterion used by Gistemp since January 2010, these three Guam stations are reclassified as urban, and are then dropped because of “too little rural-neighbors-overlap” – they do not contributed to the gridded data at STEP3.
However, if the Gistemp group eventually notice that the night time radiance adjustment they have actually carried out since January 2010 and the “standard nightlight adjustment” they describe in their draft journal article “Current GISS Global Surface Temperature Analysis” at http://data.giss.nasa.gov/gistemp/paper/gistemp2010_draft0319.pdf are not the same adjustment (and I have already commented to them on this), and actually implement this “standard nightlight adjustment” instead of the one they implement now, WMSO Agana and Andersen AFB would revert to their previous rural status, and the return of these two “rural once again” stations would provide sufficient rural neighbors to adjust the still urban NWSO Agana, so that all three would once again contribute to the gridded data.
@Peter O’Neill,
I’ve been following your work with great interest and had been working on a follow up posting, which I’ve just put up, with links to your nightlights thread.
The problem with WSMO Agana (as I now see it) is that perhaps it was starting to be affected by the encroaching urban area, not sure from when, before the record was spliced in 1998. This could be one case where it would be very interesting to examine all the data from the area.
Obviously I’m not taking account of any modifications (TOBS) etc that are not already in the data, but it is interesting to see how stations in such close proximity deliver differing patterns over several years.
Upon review of all of this information it is facinating that the temprature increase has not been more significant. Urban growth should have increased the mean temprature by at least 5-10 degrees then I remembered this is an island in the middle of the ocean which explains everything. I have enjoyed reading your work
DR
[Reply – Thank you very much. This was a little bit of investigation I really enjoyed doing. It was originally posted on Blogger and needs a tidy up]