Guest post by Peter Morcombe (link to Part 1)
Global warming or cooling effects should be magnified at high latitudes so it makes sense to look for temperature trends in the Arctic and Antarctic. Ice sheets provide excellent temperature proxies going back more than 700,000 years (Vostok) in the southern hemisphere and over 50,000 years in Greenland (GISP/GRIP).
Ten years ago, Richard Alley used data from the GISP2 ice cores to explore abrupt climate change events such as the “Younger Dryas” 12,500 years ago: http://www.ncdc.noaa.gov/paleo/pubs/alley2000/alley2000.html
The GISP2 data has previously been related to more recent warm and cold periods. See: http://www.foresight.org/nanodot/?p=3553 and http://www.rationaloptimist.com/blog/best-shot and currently http://wattsupwiththat.com/2010/12/28/2010%E2%80%94where-does-it-fit-in-the-warmest-year-list/
Unlike some other temperature proxies, the GISP2 ice core data does not require that we ignore or re-write history but it is a challenge to link up with current instrumental records. While NOAA scientists have no data that can bridge the gap between the end of GISP2 (1905) and the present day, they did suggest some other sources of information such as the Danish Meteorological Institute (DMI) station data for Greenland going back 140 years: http://www.dmi.dk/dmi/tr10-05.pdf
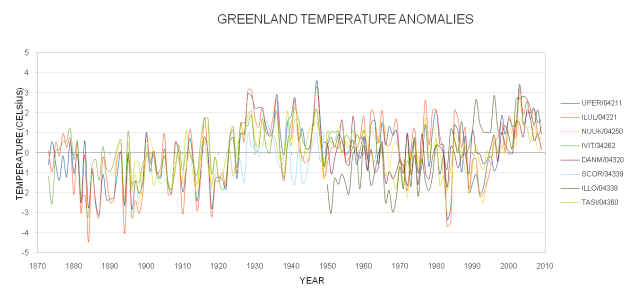
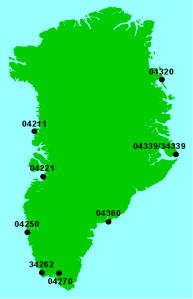 Using the DMI data, temperature anomaly plots were constructed for Greenland going back to 1873, thus providing some overlap with the GISP2 ice core data.
The correlation between these anomalies surprised me given the distances between the sites (right).
The anomalies for the 8 coastal stations were combined and averaged over a 10 year running period. As expected, the resulting plot had a strong upward trend reflecting recent “Global Warming”.
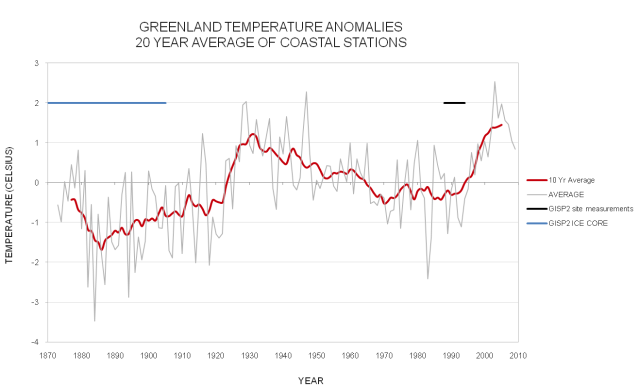 The temperature increase over the period is 2.3 oC compared to the IPCC’s ~0.8 oC for the same period (see AR4). These numbers seem to fit the idea that temperature changes are magnified at high latitudes but there are a couple of problems. Firstly, the “Hockey Stick” increase ended in 1938 and temperature declined sharply before rising again in the late 1990s. Given the relentless increase in CO2 concentrations, other factors must be overwhelming that effect in order to produce a prolonged cooling. Secondly, the rapid temperature increase over the last 12 years may be coming to an end. No doubt these changes will be dismissed as “local” but over the last several thousand years Greenland has cooled and warmed in step with locations at lower northern latitudes.
But I really wanted to look back further in time. In Part 1 showed that temperatures around central Greenland in the period 1988-94 averaged -29°C and showed some correlation with coastal stations. Actually the temperature at the GISP site was recorded only for 1989-1995 with many missing months. A best estimate for temperatures during the most complete years gave an average of -30.8°C and this allows for a look back further in time. So, tacking the above anomaly plot onto the GISP2 records produced a “Hockey Stick” that should delight Michael Mann.
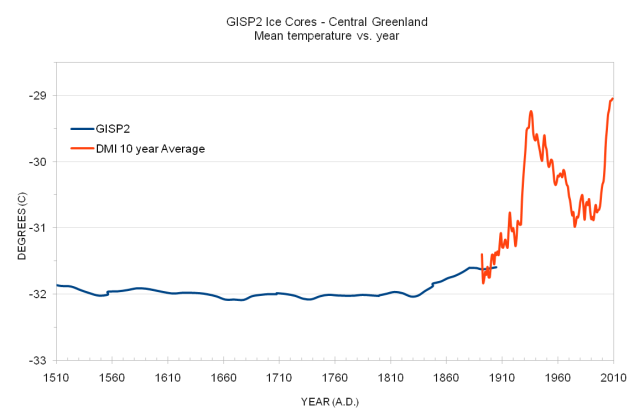 Looking even further back quite a different picture emerges with temperatures declining over the long term:
 The GISP2 ice core data corresponds closely with major historical events. The Minoan Warm Period (~1,300 B.C) is followed in sequence by two Roman Warm Periods, the Dark Ages, the Medieval Warm Period (MWP) and the Little Ice Age. Modern times appear to be warmer than the MWP, at least in this part of Greenland, but short of the temperatures reached in the Minoan Warm Period. The DMI points out that its data is unadjusted, so there may be some Urban Heat Island (UHI) effect at work, particularly with regard to the Nuuk station.
While temperatures have been rising since 1850 there have been warmer periods during the last 9,000 years and presumably prior to the formation of the ice sheet at the GISP2 location ~70,000 years ago. Abrupt temperature change, both up and down seems to be the rule during the period covered by the GISP2 data and this is hard to explain in terms of atmospheric CO2 concentration given its relatively leisurely and monotonic rate of change.
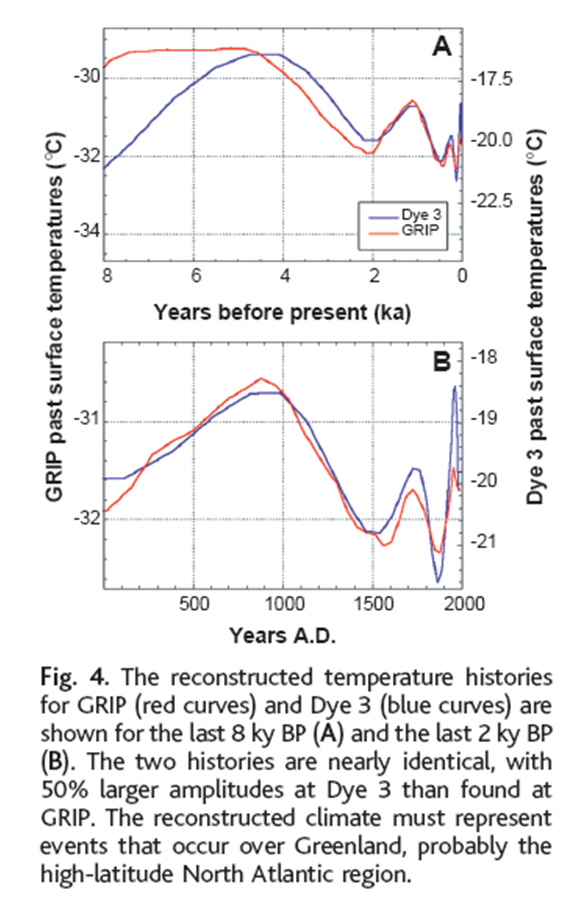 [Note – I found I’d previously been sent a paper with data from the GRIP and DYE3 Greenland ice cores. GRIP agrees with GISP2, while the DYE3 site is warmer. Both show up the warm blip in the 1930s – Verity]
DOI: 10.1126/science.282.5387.268
Science 282, 268 (1998);
D. Dahl-Jensen, et al.
Past Temperatures Directly from the Greenland Ice Sheet


Your data, the red line, represents a 10 year running average of recorded temperature. The actual temperatures vary by up to 2 degrees from the 10 year average figures. But what does the GISP2 graph represent? is it also a 10 year running average? Since its ice core data I doubt the results are so accurate. Is it more like a 100 year running average?
The longer the running average span, the greater the variation this figure will be from the real temperatures of the time. Which brings up a lot of questions as to just how meaningful these types of studies are. And thats not including all of the assumptions in how temperatures are generated from ice cores in the first place.
Its easy to become disalusioned with the Anthropogenic Global Warming hypothisis when one starts to look behind the curtain. I wish more people in media did some real thinking on the subject.
Peter sent me his data to check as well as to post. The GISP2 data actually has a 6-8 year interval in the recent years to 1905. I was surprised.
That’s not quite accurate. GISP2 ends at “0.095 thousand years BP” but “present” in BP is the standard 1950 used for radiometric dating. That means this temperature record ends at 1855.
Rob Honeycutt is right. Just to make sure, I emailed Richard Alley:
“Dear Dr. Alley,
Last October I visited Tom Peterson at the NCDC in Asheville. Following my visit I made a post that assumed the end date for your GISP2 data was 1905. Other people have suggested that is not the correct date because the Cuffey & Clow (1997) start date was 1950. Subtracting 0.095 ky from 1950 would make 1855 the start date.”
He replied:
“We used 1950 as 0 before present, and I believe that applies to what you have. If you haven’t seen…
http://dotearth.blogs.nytimes.com/2010/02/08/richard-alley-on-old-ice-climate-and-co2/“
Greg Cavanagh,
According to Alley, the GISP2 data has “decadal resolution”. I am not sure what this means but I found that even 20 year smoothed instrumental data has much more rapid variations than can be found in the GISP2 data.
The first graph shows that we are back to the same temperatures in Greenland as in 1880. Who’d athunk it?
Happy New Year
Thank you – and to you. In fact Happy New Year to everyone.
Happy New Year, Verity, and to everybody.
My wishes are:
__keeping the weather (and average weather = climate) as it is.
__If climate change is inevitable my preference is more warming, because any serious cooling will be disastrous.
PS: Here is the something about the current state of sea-ice cover in Northern Europe (per 30 Dec.2010), which hopefully do not progress in this speed much further: http://www.2007seatraining.de/
Happy New Year Arnd!
That sea ice state is interesting – I’ll keep an eye on that.
Thanks for your answers Verity and Peter.
Looking at the first graph “mean temperature v’s year”, its apparent that the ice core data isn’t terribly sensitive to real temperatures. (ie: there is a significant difference in the year to year variablility).
I’m not trying to confuse or argue any particular issue here. It does concern me when I see the yearly temperatures smoothed to a 10 year running average, where the actual temperatures are + or – 2 degrees from the smoothed. Then see a graph like the ice core data which itself looks far smoother than the 10 year running average. I just have to wander how much the real temperatures vary from the figure represented by the graph.
Which brings up the first question, just how meaningful can it be to see those troughs and hills on the century scale in the ice core data? If the line wanders within the error bar, can any conclusion be drawn by it? (It is generaly assumed to be in the centre of error, but is that a realistic assumption).
The GISP 2 Ice Core data is not hard to use since Dr. Alley made it pretty simple when he archived it with NOAA. You can copy it yourself from here:
ftp://ftp.ncdc.noaa.gov/pub/data/paleo/icecore/greenland/summit/gisp2/isotopes/gisp2_temp_accum_alley2000.txt
The dates are in Thousand years before present and the present means the year the dataset was made, 2000. So the data at the top of the dataset looks like this:
Age Temperature (C)
0.0951409 -31.5913
That translates into the year 1905 and a temp of -31.59°C. So when you get down to places like this:
2.00687 -30.1052
2.01653 -29.9572
2.01923 -29.8624
2.03356 -29.8748
2.04614 -29.8372
2.04614 -29.7996
2.0571 -29.6404
2.06824 -29.5708
That translates into temps for the years:
6.87 BC or just say 6 BC
16 BC
19 BC
33 BC
46 BC
46 BC
57 BC
68 BC
When you go back like 12,000 years or more the years between temps increases:
12.029 -46.6132
12.063 -46.5673
12.104 -46.2844
12.14 -46.9954
12.174 -47.3471
12.213 -47.7217
Which is:
10,029 BC
10,063 BC
10,104 BC
10,140 BC
10,174 BC
10,213 BC
As you can see the intervals have gone up to between 30 and 40 years roughly.
There are a least 2 datasets from the gisp2 icecore from Alley
The first (moose, alley et al 1993 )BP = 1950
The second time they did appertly more effort to get more recent climatological data from the core (Alley, R.B. 2000. The Younger Dryas cold interval as viewed from central Greenland. Quaternary Science Reviews 19:213-226.) BP = 2000 (where -95 (0.095..)is the first measurement)
“Start Year: -107175 AD End Year: 2000 AD” http://www.ncdc.noaa.gov/paleo/metadata/noaa-icecore-2475.html
And who khows wat the futere brings us, the top of the core is 1987.
Pingback: The dog that did not bark | Digging in the Clay