

Lucy Skywalker asked me if I would like to repost her recent work on UHI from her website Skeptical Real Climate Science and I am delighted to do so as she has a gift for clear explanations and great graphics, not to mention that all-important attention to detail. [Now Updated: I had originally intended this as a two-parter, but on reflection think it is better in one post. ]
Guest post by Lucy Skywalker
Ira Glickstein asked at WUWT for comments on his allocations of the 0.8°C/century global warming to: (1) Data Bias 0.3ºC, (2) Natural Cycles 0.4ºC, and (3) AGW 0.1ºC. I was not happy with Ira’s figures but I needed to quantify that. Me a vole wrestling with the IPCC elephant-in-the-sitting-room. Well, voles can notice details, go deep, get out of tight corners, and bite. I think I’ve got figures as well as lots of visual evidence.
Getting UHI accurately removed from our trends is absolutely essential for two reasons. First, it completely removes the alarming recent spike in “global” warming and shows that variation is well within natural bounds. Second, it allows solar correlation again, showing that the cause is well within natural explanations. I’ve gone down the route of examining clean data separately from infected data: inspired also by Anthony Watts’ essay showing UHI alive and well; and Steve McIntyre’s comments on the disinformation about UHI at RealClimate (and in official sources generally).
I noticed Steve Mosher’s comment (closely followed by Ross McKitrick’s comment), pointing to IPCC AR4’s sleight of hand by Trenberth and Jones, in sweeping McKitrick and Michaels’ 2004 paper on Urban Heat Island effects under the carpet, thus leaving Jones’ faulty 1990 paper to continue to allow inappropriate and inaccurate UHI corrections to the global temperature records. The Abstract of McKitrick and Michaels’ latest (2007) paper says that by using their method, “…nonclimatic effects reduces the estimated 1980-2002 global average temperature trend over land by about half.” Unlike Jones, Trenberth, and the rest of “the Team”, Ross uses appropriate statistics properly.

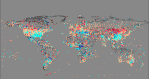
Let’s start with a favourite of mine, the presentation of Dr Andrei Illarionov at the 2010 Heartland Institute conference (U-tube here and here). Andrei shows locations for the 476 Russian records actually available, then cuts it to Phil Jones’ 121, then cuts it further to 37, 12, and finally 4. Using Phil Jones’ methods, he shows that just four records suffice to show the whole graph with 1.29°C temperature rise over the last 100 years – the four oldest records, which of course are urban. Arkhangel’sk (1813), Yeniseysk (1871), St Petersburg (1733), and Astrahan (1837).

Then Andrei divides the data into groups of different population size. He takes the average temperatures for the period 1921-1945, and compares them with the averages for 1961-1990, then with the averages for 1991-2006 (see two insets). Where there are no local residents the trends are, in both cases, a huge 0.6°C less than those for urban areas. Unfortunately it looks as if there are not enough stations from unpopulated places to show trends for the full century. The records for zero / very low population appear to be significantly lower than many records classed as “rural”, as Roy Spencer’s work below bears out. Even without this lowest group, a trend difference of nearly 0.5°C between the 10 most rural and the 10 most urban stations emerges. And since the urban stations’ trend approximates to Jones’ official Russian trend, Illarionov’s evidence shows that Jones’ trend is completely overrun by a 0.5°C per century urban heat island effect.
If that is true in Russia, what about elsewhere? Striking evidence emerges regarding the LACK of significant temperature increase in a number of significant places.
 First, there is the average of 24 US rural records, as picked out by a 6th grader schoolchild in order to compare with “twinned” urban records* right across the States. These show no overall temperature rise in a century of records. The urban records, on the other hand, show an overall rise of ~1.5°C.
 Second, look at New Zealand temperatures, when they are relieved of the fraudulent weighting they were given. No significant increase whatsoever. Third, look at a rural record from Pretoria, South Africa, chart adapted from Henry P. Temperature records for May to September were used as the Pretoria climate is sunny during this time and therefore provides a sensitive record without scattering from cloudiness, so it should show any overall global warming during this period. No increase here either.


Fourth, another look at US rural and urban records, from a paper by Dr Edward Long. Here we see the familiar up-down-up, with a significant difference: rural temperatures recently are LOWER than they were in the 1930’s; the overall trend is up, but only slightly, and visibly well within natural variations. Urban data show the familiar AGW picture. The difference between urban and rural records in 2000 AD looks like about 0.6°C.
 In researching this article, I viewed every one of the 250-odd graphs obtained by John Daly from the GISS records: “What the Stations Say“. These will be less tampered-with than more recent GISS records, nevertheless they are recent enough for their pattern to be – what is that famous word – “unequivocal” – in showing little, if any, overall rise. Every record chosen has a message. Most are rural records which, while varying considerably from year to year, show no significant overall rise. This is particularly evident with the US – while a few show a rise here, more actually show a fall. I didn’t quantify these, it was just fun eyeballing, but it’s obviously quantifiable, if anyone feels like doing this.
Next I’d like to recall the work of Roy Spencer (here and here) in attempting to quantify UHI corrections needed. While I’ve bypassed this route, and simply gone for trustworthy individual rural records and/or trustworthy statistics to sieve out the rural records, his work is important, in making a case for a significant presence of UHI, and UHI increases, that correlate to population, and population increases, in tiny populations that would generally be deemed rural and “beneath the radar” of UHI. Could this correlate to land use changes perhaps? Obviously it does NOT relate to CO2 increases! I’m not totally sure of Spencer’s figures, but they do seem to bear out those of Illarionov above, that suggest perhaps adding an extra 0.1°C/century to the 0.6°C of Long or the 0.5°C of Illarionov. That however is speculative and needs further quantifying.
 Now we can return to Ira Glickstein’s figures distributing causes of the 0.8°C agreed global temperature rise of the last century. I’m going to plump for Natural Change 0.3°C and Data Bias 0.5°C, though difficult-to-catch evidence at the bottom end here suggests that the natural rise might be even less and the data bias might be even more. As to marginal genuine human effects, I would suggest land use change, as possibly suggested by Spencer. But for CO2 there is now no room left, in my opinion. The continuing steady CO2 rise can be explained in the centennial time scale we know exists for CO2 following temperature, the time between CO2-rich water sinking in polar waters and emerging in the tropics.
At this rate of natural change, I anticipate that TSI correlation will come into its own again. What is interesting is how the arctic North Atlantic records seem to magnify the solar patterns more strongly than anywhere else in the world. Interesting too that this whole group were also the most prolific early keepers of careful records.
*Pairs of NASA GISS records used by “Peter”: Gardiner to Portland, West Point to Central Park, Maryland to Albany, Lowville to Syracuse, Hemlock to Rochester, Angelica to Buffalo, Smithfield to Raleigh, Santuck to Charlotte, Arcadia to Fort Myers, Inverness to Tampa, Newnan to Atlanta, Philo to Columbus, Vevay to Cincinnati, Whitestown to Indianapolis, Brinkley to Little Rock, Amite to Baton Rouge, Albia to Des Moines, Saint Peter to Minneapolis, Kingfisher to Oklahoma City, Boerne to San Antonio, Los Lunas to Albuquerque, Tombstone to Tucson, Roosevelt to Phoenix, Morgan Como to Salt Lake City, Cuyamaca to San Diego, Lemon Cove to Fresno, Colfax to Sacramento, Hood River to Portland.

Nice work Lucy.
McKitrick and Michaels’ (2007) paper showing “…nonclimatic effects reduces the estimated 1980-2002 global average temperature trend over land by about half.” ties in nicely with Tom Wigley’s e-mail to Phil Jones (1257546975.txt) that “Land warming since 1980 has been twice the ocean warming — and skeptics might
claim that this proves that urban warming is real and important.”
Lucy,
You really need to get this thread up on WUWT as well as here on DITC!
[reply – I have alerted WUWT – V.]
This is a very good summary of why it is so important to properly allow for UHI when adjusting the so called ‘raw’ data. Despite what the good Dr Phil might think, UHI is very evident within the historical temperature record, yet somehow or other it is allowed for by lowering the temperatures of the past relative to more recent temperatures. Go figure!
Thanks Charles that’s interesting. However, I’d hesitate to put too much significance to that one because I can imagine ocean temperatures as fluctuating altogether less than land temperatures. But land versus land – nobody can complain!
Thanks for the thumbs up everyone.
Lucy,
Thanks for let me post this here. I am disappointed that it wasn’t picked up by WUWT but it is still attracting interest here, and I think it is a subject that need much more, really serious attention from both pro-AGw and sceptics alike.
Interestingly all of the 0.3 degree warming took place between 1910 and 1944, (pre CO2) and the recent warming peak ca 1998-2006 is not higher, and probably lower than the last one ca 1938-1944.
Lucy
Nice post.Obviously a lot of work has gone into it so hope it will each the widest audience.
Tonyb
Nice work Lucy. It demands an answer from the team.
Lucy
I se that your article has still not appeared on WUWT, lets hope it happens over the weekend. As I know, these articles take a long time to produce and it is deflating if they do not gain the widest audience. It is good to get comments as well, as often someone might point out a point of amplificatiion or a mistake that enables the article to be refined.
Tony
I grew up on a farm in the 1940’s and 1950’s in southern Minnesota. This was before people had air conditioners. My uncle and aunt lived in a small town with a population of ~1500 nearby. In the hot summer evenings they would go for a drive in the country to cool off. It takes very little to create a heat island. The trees that were planted in the town cut down on air circulation and the streets and buildings provided thermal mass that held the heat. I believe that the standards used for classifying surface stations as “rural” may be something like populations under 10K or 50K. The problem is that the impact of urbanization decreases with size. It is not necessary to have a large metropolis to get a heat island effect.
I’d thoroughly agree with that – I think we take the siting issue far too lightly. Yes, the rural classification is <10,000 population, although now that there is a move to using 'nightlights' (https://diggingintheclay.wordpress.com/2010/04/06/nightlights-and-shifting-sands/) that classification will be blurred.
Good article. It seems to me that every single station needs to be examined and rated as per Anthony’s weather station project before any reliance can be placed on the raw data, let alone checking electronic thermometers for drift etc. Any other scientific discipline would regard this as essential.
Thanks for comments all. Sorry to be slow here. I’ve been doing a major revision of my Primer (click my name) and I’ve now done TWO updates of the UHI article. So if it gets to WUWT it will be a better article altogether.
I’ve been glad to redo my “Primer” because I believe this is really important, having a piece on hand that deals with the WHOLE climate skeptics’ issues, and is accessible. It’s a step towards a wiki. And it stands in its own right. Any comments on that please email me privately.
Lucy, here’s another piece of research addressing the pernicious effects of UHI on long temperature series, in this case for the city of Brussels.
http://www.mdpi.com/2072-4292/2/12/2773/
In particular, it shows that increasing UHI effects over time have a significantly greater influence on Tmin than Tmax, by a factor of nearly 3 times, thereby skewing average daily temperature readings by 0.15C per decade, or 0.6C over the 40 year period of the study.
As I read it, this makes a nonsense of not only the absolute temperature readings for urban stations without appropriate adjustment, but also the use of simple anomalies (Tave 2 minus Tave 1), because in both cases any apparent upward trend will be exaggerated by a factor of 3.