
Prepared and posted by ‘KevinUK’
[Important Update: After coming across this thread entitled ‘Comparing Surface Temperature Records’ on the TreesfortheForest blog and therefore being reminded of the warming/cooling trends in the MGST anomaly chart, I have decided to re-analysis the trends and maps for the time period from 1880 to 1939. It is evident from MGST anomaly chart that 1880 to 1910 was a cooling period followed by a warming period from 1910 to 1939. Consequently I’ve now split the previous analysis for 1880 to 1939 into two distinct time periods i.e from 1880 to 1909 and 1910 to 1939. The results are very interesting so please re-read the whole of this thread]
Recently I’ve been working in collaboration with Verity (vjones) on ‘mapping’ possible global warming/cooling in both the NOAA and GISS GCHN raw and adjusted datasets. This work has resulted from the recent work we’ve been doing on developing a database and user interface to the data (TEKTemp) for storing all the NOAA and GISS raw/adjusted data. TEKTemp is described in more detail in another thread here.
I don’t like seeing raw (or for that matter adjusted data) presented in the form of ‘anomalies’ from a so called ‘reference period’ and so have chosen thus far instead to break with convention and do all my trend analysis of the NOAA/GISS data using actual raw/adjusted temperatures. One of the great advantages of computer programming is that it enables you to repeat repetitive tasks very easily (a DO …. LOOP) and so it’s been possible to create charts that show the raw and adjusted data (and trend lines for each) for the many thousands of stations in the NOAA/GISS datasets.
After performing the trend analysis (linear regression) for each station I then needed a convenient user-friendly way in which to present these seevral thousand charts to anyone who is interested in looking at indiviudal stations and so I came up with the idea of using an interactive map. After a bit of Googling I managed to identify a nice free-to-use Flash map application called ‘DIY Map’ which as you’ll see does ‘just the job’ I need it to do.
The first thing to note is that I’ve analysed the NOAA GHCN and GISS GHCN datasets separately and so have produced completely separate ‘interactive maps’ for each dataset. The NOAA maps are here
NOAA raw/adjusted data interactive maps: http://www.climateapplications.com/MapsNOAA.asp
and the GISS map are here
GISS raw/adjusted data interactive maps: http://www.climateapplications.com/MapsGISS.asp
The map uses an XML file which is loaded into the DIY Map application. The application is written in Flash (Actionscript) and so it can take a while for the map to load all the XML data and display it. As the data is loaded you will most likely see a prompt which says that it is taking sometime for Abobe Flash 10 Player to load the application data. If so then when prompted please click ‘No’ on the prompt that appears and eventually the full colour map be displayed.
The interactive maps (accessible using the links above) allow you to zoom in to a given country just by clicking on a part of that country and you can just as easily zoom out again. Note that there is a colour coded ‘dot’ on the map for each station in the NOAA/GISS dataset. When you hover over a dot it pops up a little ‘summary info’ window which tells you the name of the station, its WMO station code and raw/adjusted trends. If you then click on the dot a new browser window will open showing a chart of the raw/adjusted data for that station. As I get more time I’ll add further info to this station details page.
Each map has a legend which explains the colour coding for the station dots. Most of the maps show colour coded raw/adjusted slopes for the linear trends in the stations raw/adjusted temperature data. Note the units for these slopes are ‘deg.C/century’.
To save some space on this thread and since the legend is the same for all the maps that show raw/adjusted temperature trends here is an image of the slope legend (Figure 1). Note the colours and the corresponding slope ranges when you view the maps that follow on later in this thread.

Now let’s make a start by looking at the raw NOAA data as shown in the following JPEG captured image of the NOAA 1880 to 2010 raw data map (Figure 2).

Note that the so-called ‘global warming’ (the slope fitted to all available raw data between 1880 to 2010 for a station) for all stations is certainly not ‘uniform’ throughout the planet. Indeed it indicates that there are certain regions e.g. the US that show warming in certain parts of the country e.g. the North West US compared with cooling in other parts e.g. the South East US. Note these are warming/cooling trends for all available raw data fro the period from 1880 to 2010. Only a few stations are ‘long lived’ i.e have raw data that spans this whole centennial long period. In fact most stations are only ‘short lived’ having raw data that only spans the period from 1950 to 1990. So when you see a ‘dot’ on the following map please bare in mind that the trend for many of the stations may only represent the trend in the raw data from 1950 to 1990 and not the whole 1880 to 2010 period.

Now let’s look at the same NOAA data but this time ‘adjusted’. Note as with th era wdata above that only a few stations are ‘long lived’ i.e have raw data that spans this whole centennial long period. In fact most stations are only ‘short lived’ having raw data that only spans the period from 1950 to 1990. So when you see a ‘dot’ on the following map please bare in mind that the trend for many of the stations may only represent the trend in the raw data from 1950 to 1990 and not the whole 1880 to 2010 period.

By comparing Figure 2 (raw slopes) with Figure 4 (adjusted slopes) it is evident that the raw and adjusted slopes, when seen on a global level, aren’t that different. Indeed when viewed on a global level many of the warming/cooling trends seen in the raw data are still evident in the adjusted data i.e. the adjustments do not appear to have that much effect on the ternds seen in the raw data.
This isn’t necessarily the case when it comes to individual stations and indeed as my previous thread on the ‘Physically unjustifiable NOAA GHCN adjustments’ showed, for some individiual stations ‘cooling is turned into warming’ (e.g. Edson) and ‘warming is turned into cooling’ (Mayo). The similarities between Figures 2 and 4 would seem to indicate that the adjustments do not have any significant effect on the general spatial variations in the raw data trends.
Now that is NOAA GHCN version 2 but what about GISS?
Here are the equivalent colour coded raw/adjusted maps for GISS shown in Figures 5 and 6 below.


It’s worth noting that Figure 5 (GISS raw) is not significantly different to Figure 4 (NOAA adjusted). This is not surprising given that GISS takes as its raw input the NOAA GHCN raw data with the US data replaced by USHCNv2 ‘partially adjusted’ data and also adds in raw SCAR data for Antarctica. In effect the GISS raw data for the rest of the world (ROW) is identical to that for NOAA GHCN. Note also by comparing Figure 5 to 6 that the net effect of the GISS adjustments for the US stations is to convert much of the cooling trend for many US stations in the South East of the US to warming stations.
To re-iterate what was satted before, it is important to appreciate that, in all the maps shown so far, the calculated trend slopes have been for all available data between 1880 to 2010. Many of the stations included within the NOAA GHCN (and so therefore also GISS) dataset are not ‘long lived’ i.e. do not have data that spans this complete centennial period. In fact many of the stations only have data from around 1950 through to 1990 i.e. an approximately 40 year period which is known to include a cooling period (approx. 1940 to 1970) followed by a warming period (approx. 1970 onwards). It is generally acknowledged (as evidenced by the MGST anomaly chart seen here) that the period from 1880 to 1910 was a cooling period followed by a warming period from 1910 to 1940, so it would be informative to fit separate slope trends to these 4 distinct warming/cooling time periods i.e. from 1880 to 1909, 1910 to 1939, 1940 to 1969 and 1970 to 2010. Figures 7, 8, 9 and 10 below show the colour coded GISS raw data slope trend maps for each of these periods respectively.


Figures 7, 8, 9 and 10 show some very interesting details, so lets start with Figure 7. This shows the slope trends in the GISS raw data for all available data during the period from 1880 to 1909. Note the contrast in warming and cooling in different parts of the globe. Despite warming in the Southern US stations there is a significant warming trend in almost all the Canadian stations along the 49th parallel. There is a cooling trend in the northern Norwegian stations while there is a warning trend in Iceland. There is a signifant cooling trend in most of the Japanese stations as well as in most of the Southern Australian stations. Note the almost complete lack of available data for Africa, Siberia and China and most of South America.
Figure 8 shows the slope trends in the raw GISS data for all available data during the period from 1910 to 1939 and so therefore includes the record warm 1930s as evidenced by the dark red/pink area in the central US. Almost all o fthe US stations are shwoing significant warming trends. Look at the high latitude dark red dots for teh staions in Greenland, Iceland, northern Norway and Russia. Look at the significant cooling trend in most of the Indian and South Eastern Australian stations. It clear that there are substantial differences in the warming/cooling trends between the two global hemispheres. This is demonstrates clear and signifcant natural climatic variability during this time period in different parts of the world.
It is very important to bare in mind the lack of stations in most of the ‘rest of the world’ outside of the US with the exception of Western Europe, Australia and Japan during the period from 1880 to 1939. In particular as can be seen from Figures 7 and 8, there are only a few stations shown in China. Also note that, despite the warming trend in much of the Northern Hemisphere between 1910 to 1939, there is a noticeable cooling trend in most of West and Eastern Australia, India and central Japan during the same time period. What if we had better coverage? IN particular what if we had much better coverage in Siberia and China? If we did then we’d be in a mcuh better positin to compare the warming and cooling periods during thi s1910 to 1939 period with those of the late 20th century.
Figure 9 shows the slope trends in the GISS raw data for all available data during the period from 1940 to 1969. There is a clear cooling trend in almost all of the US, Canada and Western Europe i.e. almost all the Northern Hemisphere with one or two noticeable exceptions, in particular Japan and Eastern Europe in and around the countries bordering the Caspian and Black Seas. The trends for Australia are not significantly diferent to those for the preceding the 1880 to 1939 period.
Figure 10 shows the slope trends in the GISS raw data for all available data during the period from 1970 to 2010. In stark contrast to the preceding 1940 to 1969 period there is a clear significant warming trend in almost all of the US, Canada and Western Europe i.e. almost all the Northern Hemisphere and much of the Southern Hemisphere, also with one or two puzzling noticeable exceptions. For some reason there is a noticeable cooling trend in many of the Eastern Europe stations in and around the countries bordering the Caspian and Black Seas. Again the trends for Australia (and Japan) although generally warming are not that significantly different to those for the preceding 1880 to 1909, 1910 to 1939 and 1940 to 1969 periods. In fact it appears that global warming has never taken place in Western Australia at any time during the 20th Century (8-)).
Its also important to note the very significant warming trend observable in the Canadian stations north of the 49th parallel and in many of the stations in North Eastern China. Why is this? This is certainly worthy of further investigation.
Its also very interesting to compare Figure 8 with Figure 10. Allowing for the lack of coverage from 1910 to 1939 compared to 1970 to 2010, the warming period from 1910 to 1939 is not that dissimilar in extent and magnitude to that from 1970 to 2010. This is a puzzling find as 1910 to 1939 is a period that is generally acknowledged as a period that falls well before the rapid industrial development post the second World War in which the world’s population, largely fuelled by use of fossil fuels expanded enormously thereby leading to significant concerns as to the effect man was subsequenlt having on our planets climate. It woudl seem that base don Figure 8, the 1970 to 2010 warming trend is not ‘unprecedented’ even within th elast century let alone millenium as people like Michael Mann and Phil Jones would have us all believe. Indeed it would appear that the late (i.e 1970 onwards) 20th century warming trend could well be largely due to natural climatic variability just as the 1910 to 1939 warming trend was and not due to largely to man’s emissions of GHGs (i.e. CO2)?
Up until now all the trends presented are year mean temperature trends. Could there be anything to be found if we look at seasonal trends as well as year mean trends? With this in mind, I’ve also produced maps showing seaonal trends (DJF, MAM, JJA and SON) for the 1970 to 2010 period for both the NOAA and GISS datasets. Figures 10 and 11 below show the raw data trend maps for the GISS dataset for DJF and JJA respectively.


Now Figure 10 is clearly dramatic! Just look at all those dark red dots (> 5 deg.C/century warming trend) in the Northern US and all of the Canadian stations, and similarly most of the former USSR i.e. Russia, Kazakstan etc, Mongolia and North Eastern China stations! Despite this clearly alarming warming trend, there is at the same same an observed cooling trend in much of central China and, puzzlingly, in much of the Balkans, Greece and Turkey? Looking at the Southern Hemisphere for this DJF seasonal period i.e. summer period in the SH, Western Australia appears to refuse to be warmed!
It is then even more puzzling to contrast Figure 10 with Figure 11 which shows the JJA seasonal period trends. Much of the alarming warming trend evident in the DJF trends for the Northern US and Canadian stations has vanished and in fact has been replaced for some of the Central US stations with a cooling trend. Similarly the many of stations in central China as in Western Australia refuse to show any warming trend! It also looks as though if you want to get a good tan, then ‘the Med’ whether it be the South of France, Italy, Greece or Turkey is a good place to head for and temperatures are clearly rocketing up in the summer. Don’t forget to pack your sun protection cream though!
Seriously though, these seasonal trend maps would appear to indicate that that much of the claimed global warming is hardly global at all. In fact it looks to be more accurately Northern Hemispshere warming, and for that matter primarily Northern Hemispshere WINTER warming! Clearly CO2 is choosey! It’s happy to only take full effect during the winter time in the Northern Hemispshere and even when it does it is also happy at the same time to allow some exceptions. It looks very much like Western Australians need to apply to Kevin Rudd for a carbon tax rebate. Sadly in the UK, out Met Office has fudged the raw data so much that, try as I might, I can’t on the basis of these maps justify a rebate for the UK taxpayer.


The maps are very interesting but I am bemused as to why there is no data at all for North and South America plus Australia?
There seems a disproptionate number of stations in Canada-have they migrated from America as a result of my browser type?
tonyb
Very nice presentation that clearly indicates where the data is.
“Clearly CO2 is choosey! It’s happy to only take full effect during the winter…”
Since winter is when water vapor and its IR absorbtion are lowest, CO2 could be expected to have more effect then.
Steve Reynolds
What a marvellous resource! Look how the stations are concentrated in a band across the N hemisphere, and how few in the S. From zero to precious few in much of Africa and parts of S. America.
Jim Hansen complained how people were taking a mere 2 percent of the globe (USA) as being in any way representative, but an eyeball estimate gives me a maximum coverage of around 10 percent at reasonable station densities. And this is what global thermometer measurements are based upon?
Thank you so very much for the effort you have put into this. I hope this resource gets the attention it deserves!
Anonymous,
You need to be careful as to which map you look at. As I mention in the text and as verity has shown on a different thread, the no. of ‘reporting’ stations i..e sttaions for which data is available in any given year is quiet considerable. For some reason there are a lot of ‘short lived’ stattions in the NOAA and GISS datasets. Many of these stations only have data between approx. 1950 and 1990. In 1989/1990 a great many stations stop ‘reporting’ their temperatures to NOAA so there is a huge ‘drop out’ of stations from the NOAA/GISS datasets.
I’ll be doing another thread on this specific point shortly as many people are unaware of this important fact.
EMS has indicated in the analyses of the NOAA and GISS data that he has carried out on his ChiefIO blog , that he thinks the station drop outs are the primary cause of the claimed late 20th century warming trend. As yet personally I’m not convinced of this and so will be reproducing (and hopefully demonstrating via these coloured maps whether his conclusions are sound or not) his analysis shortly.
Steve,
“Since winter is when water vapor and its IR absorbtion are lowest, CO2 could be expected to have more effect then.
“
In general I’d acknowledge you statement as from a physics perspective it makes a certain amount of sense. However it doesnt explain why its still possible for a winter warming trend to occur in one part of the northern hemisphere (NH), yet a cooling trend exists at the same time in a different part of the NH. I’ve persoanlly far happy to convinced that these observable difference in differential warming/cooling trend could be caused by differences in water vapour concentration/relative cloud cover, particularly late evening/night time cloud cover. Water vapour is after all the primary GHG as it provides between 90% to 95% of the GHG effect of our planet.
Michael,
“Jim Hansen complained how people were taking a mere 2 percent of the globe (USA) as being in any way representative, but an eyeball estimate gives me a maximum coverage of around 10 percent at reasonable station densities. And this is what global thermometer measurements are based upon?
“
When Steve M first point out the Y2K error in the GISS dataset and Jim Hansen came out with this statement I too found it hard to believe. This is why IMO, they try to obfusate the issue by showing those wonderful colour contoured gridded data anomaly maps. They make no sense what so ever given the lack of coverage in ceratin pasrts of the globe. As my maps show above the ROW coverage (even in populous China)prior to 1950 is very poor. If you cant be certain as to how significant the 1930s warming was in most parts of the world, how can you be confident that any recent warming seen post the 1980s is exceptional in recent times let alone ‘unprecedented’ on a millenial timescale (as claimed by Mann, Briffa et al)?
Thanks for you comment in regards to the usefulness of this as a resource. Hopefully you’ve zooome din and clickedcon some of the ‘dots’. It would be very useful if you could do this for some stations and then check my charts against those generated my Makiko Sato on the GISS web site. In my case (unlike GISS) I combine both the raw and adjusted data on the same chart. I’ll sortly be adding the trend lines for the 1880 to 1939, 1940 to 1969 and 1970 to 2010 time periods to these charts. Thankful TEKTemp does all the leg work for me i.e. it generates all the charts as save sthem as JPEG images for me. I just have to tell what I want to include in the charts. If I can do this then there’s really no reason why GISS couldn’t do the same as it makes it much clearer as to exactly how each station is adjusted and what effect the adjustments have (at different time periods) on each station.
For anyone intersting in knowing these interactive maps are running on my ‘test’ web server. It’s an old Compaq EVO desktop PC that is at least 5 years old and has about 512 megs of RAM and a less than 80 Gig hard drive, yet it is managing to do a far better job than NASA’s GISS web site. AS you can hopefully see ‘it’s not rocket science’ is it (I’ve always wanted to say that!!)?
The TEKTemp database that houses the NOAA/GISS raw/adjusted data seen in the maps above is an MS Access 2003 .mdb file that is approx 250 megs in size. I’ll be releasing Version 1.0 of the TEKTemp application and the TEKTemp database shortly. It will be available for download from my FTP server (the very same PC that runs my web server). Shortly after that I’ll be releasing the source code for TEKTemp (its currently written in Visual Basic 6) under a creative commons licence for all to view and audit. If there is any interest in the code, I’ll be happy to then port it to VB.Net/C# as an open source project.
Hi Kevin,
I have indeed been playing around with the interactive maps and will be doing more. I’ve also been interacting with vjones, who I believe collaborates with you, over at Chiefio. Doubtless he (she?) will be relaying to you what’s been going on there regarding the work you’ve been doing. Or maybe you’ll take a look yourself at the “The Bolivia effect” thread.
Michael,
Once again thank you having a look at the maps. I’m particular pleased to see that you’ve been discussing them along with other like Vjones and TonyB on E.M. Smith’s ChiefIO Bolivia Effect thread.
Over the Christmas/New Year’s I spent a lot of time reading a number of threads by various bloggers who have been analysing the NOAA/GISS GHCN data e.g. E.M. Smith, JeffID, Giorgio Gillestri, RomanM, hpx83, Andrew Chantrill etc. It’s their work that has lead to the trend maps that you’ve seen on diggingintheclay. It’s particularly encouraging to see so many people performing these analyses largely independent of one another. I’m a firm believer in reproducing other people’s work and then hopefully extending it with a further ‘twist’. In my case I believe I’ve been the first blogger to produce maps showing the warming/cooling trends evident during three distinct time periods i.e. 1880 to 1939, 1940 to 1969 and 1970 to 2010 and not a single anomaly to be seen!
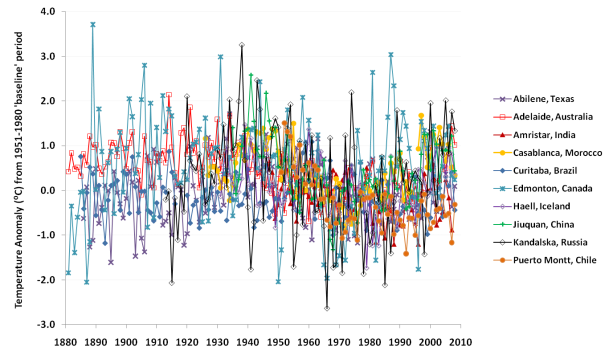
I don’t like the anomaly charts at all and the idea of ‘anomalising the data to a reference period’ prior to looking for trends is just plain wrong in my opinion. Doing that IMO is bound to remove what could turn out to be very important information that may be discoverable within the raw temperature data. As the 1970 to 2010 DJF and JJA seosonal trend maps show there are significant differences in the multi-decadal warming/cooling trends within continental land masses between winter and summer. I particular dislike those colour comtour anomaly maps as typified by the anomaly map at the top of this thread. IMO they are nonesense.
I’m an ex-nuclear physicist who has done lots of finite element analysis (FEA) and these colour contour maps very much remind of the temperature contour maps I used to produce using HKS’s finite element heat transfer software back in the 80s/early 90s. It always used to make me laugh when some of the younger modellers actually believed the ‘hotspots’ they found when looking at these types of contour maps. On one occasion I had to commission a full scale experiment in a ‘real’ reactor to convince them that the models where just wrong. IMO there’ll never be any substitute for conducting a real experiment in a real (preferable full scale) real environment as no matter how much ‘cheaper’ modelling you can do with computers, you’ll always IMO just end up fooling yourself.
This IMO is what the GCM modellers have done. They’ve fallen into the trap of believing in the ‘pretty pictures’ when in fact they should just stop well before the point at which they are clearly extrapolating well beyond the ‘validity boundary’ for their models. There really is only one solution to this problem. They MUST carry out more ‘real’ experiments akin to the CERN CLOUD experiment for example that look in much more detail at the fundamental phenomema that exist in our climate. It’s just completely unscientific, in fact its ‘nonesense science’ IMO to assume that you can ‘parameterise’ your model based on ‘hindcasting’ to past instrumental/proxy temperature data and then proceed to claim your model is ‘valid’ and so embark on a flight of fantasised projections of future centennial scale ‘dangerous’ climate change.
found your site from verity at E.M.Smith http://chiefio.wordpress.com/2010/01/08/ghcn-gistemp-interactions-the-bolivia-effect/#comment-2814 site
keep up the search for truth/knowledge, we/the public need your input/findings desperately to counter the B/S.
Great work, excellent maps (am I supposed to be able to click on the dots because nothing happens when I do..)
Re your (KevinS) comment above: “They MUST carry out more ‘real’ experiments.. that look in much more detail at the fundamental phenomema that exist in our climate. It’s just completely unscientific, in fact its ‘nonesense science’ IMO to assume that you can ‘parameterise’ your model based on ‘hindcasting’ to past instrumental/proxy temperature data and then proceed to claim your model is ‘valid’..”
I believe, from scanning a lot of papers, that there is currently a huge effort in assessing real data against models, (not just GCMs, also more focused models) to investigate and improve the models.
However, I do agree 100% with the comment about hindcasting to past temperature data and then claiming your model predicts the end of all things. Or whatever it predicts.
This aspect makes climate science (or those practitioners/claimers) possibly the worst science of the last 30 years.
And no wonder so many scientifically literate people don’t believe in AGW. Especially anyone who has worked in computer models.
For myself, a long time, I worked in a team on semiconductor development and we used models as one part of our development effort. These were much better understood than climate of course, but on much more limited computers.
The one thing that was always true was that before each new run, the models matched the past experiments – that is how modelers work. But then the results of the next model run rarely matched reality (the new experiment that followed what the models suggested was best).
Probably some of the parameterizations were wrong. Probably the exact knowledge of the doping and impurity profile through the device was faulty. And the modelers always claimed that “it’s not bad, a bit more work and we’ll be there..”
Whatever I could say about about these models is 100x more relevant to climate models. In the case of semiconductors the equations were pretty well established, mostly being well-known electric field equations.
So to say “we match the past 100 years of temperature very well therefore the models are reliable” – a joke on all of us.
Check out scienceofdoom.com
Hi all
I find it’s an very interesting analysis. A question that puzzles me is the relevance of a global average temperature since the radiation emitted by the ground is actually proportional to the fourth power of the temperature. Taking the fourth root of the average of T^4 is NOT the same as averaging the temperature. In case of (spatial or temporal) fluctuation is a ^3 ponderation factor that makes the variability of cold places much less important in the average that variability of hot places in the average. It is striking (and understandable) that much variability occurs on the coolest place – highest latitudes of the northern hemisphere during winter.
This completely hidden in an anomaly map since anomalies are NOT ponderated by the average temperature. If you decrease by 1°C the average temperature of the equatorial -tropical zone and increase by 1,1°C the average temperature of the high latitude zone (border at – 30°S – +30°N to halve the whole earth), the average temperature will INCREASE but the effective temperature will probably DECREASE.
So an interesting exercise could be to plot the trend of the forth power of temperature , Kevin 🙂
Kevin, I have a problem with your maps. The very high warming trends (> 4 ou 5 °C/century) plotted on the maps and indicated by the pop-up window when you position the mouse on a station do not match with the slopes of the graphs, that are much lower ( usually between 1 and 2 °C/century ) I tried in France (I was surprised by such high values)
Great job!!
I have had no problems with the maps – the INTERACTIVE maps are behind the hyperlinks. The pretty pictures of the maps are JUST PICTURES. Doh!
Steve Carson – you said: “Since winter is when water vapor and its IR absorbtion are lowest, CO2 could be expected to have more effect then.
So when we have least water vapour in the air we get MORE effect from CO2 and (Fig 10 – most warming in continental climates), yet water vapour is supposed to account for the largest percentage of the greenhouse effect and supply a positive feedback? This does not make sense.
Sorry, may be I’m stupid… I look at the year average in the 1970-2010 adjusted GISS data
http://82.42.138.62/GISSMaps/stationtrends1970to2010adjusted.asp
there are a lot of dark red points in France indicating a trend > 5 °C/century ….
Bourges for example : map and mouse show “Raw slope 4.44 °C/century Adjusted slope 5,38 deg/century”
but on the graph , you see :
adjusted data is 2.87 °C/century and raw data only 0.82 °C.
By the way, although it’s not that high, the “adjustment” (which is mainly the suppression of pre 1900 points) makes a big difference…But of course it could make sense to suppress these points if you just want the local slope in the last decades.
More puzzling, the “linear trend” looks more like a “sudden jump” around the 90’s, followed by a kind of plateau… not exactly what you expect from a correlation with CO2…
For those of you who are going as far as actually clicking on the ‘dots’ on the interactive maps, please appreciate that at the moment this is a work in progress.
The station details pag ethat opens up when you click a dot on the interctive map, at present, only shows the trend lines for the 1880 to 2010 period (for all available raw and adjusted data for that time period).
Consequently it is a bit confusing at present when you click the station dot via say for example the map that shows the trends for 1970 to 2010. The values shown on the chart for raw and adjusted trend just below the chart title (that gives the WMO sttaion code and Station name) are for the full 1880 to 2010 period and NOT for the 1970 to 2010 period.
I’ll be adding additional trend lines to the charts for the 3 separate time periods i.e. 1880 to 1939, 1940 to 1969 and 1970 to 2010 very shortly. For now, if you look just below the chart you will see a table that summarises the year mean and seasonal mean trends for each of the 3 time periods.
Note that many of the NOAA/GISS stations do not have temperature records until after 1950 and many of them ‘drop out’ at around 1989/1990. I’m just about to add a new thread today containing lots of charts showing the no. of raw and adjusted stations in the NOAA/GISS datasets as a function of time i.e. from 1880 to 2010.
Others like JeffID have produced similar station number charts but not as colourful and as detailed as the ones I have produced. They are quite dramatic and have certainly surprised me. For example I had no idea that Turkey was such a popular place to measure temperature between 1960 and 1990!! For some reason since 1990 NOAA has lost interest in the temperature in Turkey.
make sure you have a good look atthis new thread which should be up by early this evening. You can then theorise for yourselves as to just exactly what is going on in the NOAA GHCN raw dataset post 1990! It loks to me as if most of the world’s national meteorological services (NMSs) have either fallen out with NOAA or more likely that NOAA ha snot decided to process the CLIMAT data that is sent to them from the NMSs and load it into the GHCN raw dataset. If so, then why have they done this?
OK Kevin, sorry for the stress, you’re doing a great job !! so the maps are correct but the charts show up to now only linear trend on the whole period.
some funny “adjustments” 🙂
http://82.42.138.62/GISSMaps/showstation.asp?wmostationcodeid=720&wmoflag=0
http://82.42.138.62/GISSMaps/showstation.asp?wmostationcodeid=2023&wmoflag=0
http://82.42.138.62/GISSMaps/showstation.asp?wmostationcodeid=238&wmoflag=0
Yes, some VERY funny adjustments, which was the reason we got into this in the first place.
I’ll bet that your winter warming is mostly confined to nightime higher low temperatures, which are shown to be a function of low nightime wind speeds and the shallow nocturnal boundary layer. See:
http://pielkeclimatesci.files.wordpress.com/2009/10/r-321.pdf
In fact, Pielke, Sr.’s article suggests that only maximum temperatures should be used for studies like this for that very reason.
Wes
Thanks Wes. I’ll take a look at that. The locational aspect is now very clear from Kevin’s maps, so I hop a lot of people can start looking into why
Regarding Winter warming shown in much of NH in Figure 10, AJStrata shows analysis of daily data over a year for one station that provides an illustration of much higher variability of Winter temperatures than those in Summer: http://strata-sphere.com/blog/index.php/archives/12246
Please re-read this whole thread as I’ve added some further maps that are significant. In particular I’ve split the 1880 to 1939 period into two separate periods from 1880 to 1909 and from 1910 to 1939.
The 1910 to 1939 period is a clear warming period particlarly in the US which has most of the globes ‘long lived’ stations i.e. stations with arw data that spans more than 40 years. When compared to the 1970 to 2010 and allowing for the lesser coverage, it is clear that the 1970 to 2010 warming period is certainly not ‘unprecedented’ in the last century let alone millenium as Michael Mann and Phil Jones would have us believe.
Ways to Influence People Online and Make Them Take Action
Influence can be defined as the power exerted over the minds and behavior of others. A power that can affect, persuade and cause changes to someone or something. In order to influence people, you first need to discover what is already influencing them. What makes them tick? What do they care about? We need some leverage to work with when we’re trying to change how people think and behave.
http://www.onlineuniversalwork.com
Pingback: “They believe it is cyclical” | Digging in the Clay
Anonymous (Jan 19) said: “Since winter is when water vapor and its IR absorbtion are lowest, CO2 could be expected to have more effect then.”
Since water vapour is the evil hand maiden of CO2, would not the summer (higher humidity period) show the GREATER effect at that time? The dry, winter period would show closer to simple CO2 effect, a multiple of which should be the humid period. Can’t have a CO2 villian both causing a positive feedback with H2O one week and say you will see its effects best when there is the reduced H20.
[Reply – I think the comment refers to the fact that the presence of water vapour will tend to drown the effect of CO2 when humidity is high and the we have more chance of seeing the effect of CO2 in Winter as proportionally it will have more effect. I agree that the way it is written it is not terribly clear. Thanks for pointing it out.]
This is interesting.
One thing you should consider is the effect of sulfur dioxide and other aerosols associated with industrial activity. These have a well-known cooling effect, and may have played some role in the cooler weather in the U.S. during the post-war period through the 1970s. Control of SO2, which contributes to acid rain, has reduced this cooling signal.
It would be interesting to look at the anomaly in Eastern China through this lens. Could there be an uptick in coal combustion (with related SO2 production) in this part of China during the last few decades?
Yes that has been pointed out before, however, the actual pattern of temperatures observed, including the cooling period is a much better fit to natural cycles such as the Atlantic Multidecadal Oscillation (e.g. http://notrickszone.com/2010/09/25/arctic-temperatures-coincide-with-amo-and-not-co2/)
The location of elevated SO2 seems to make little differnce:

And a similar cooling can be found in stations all over the world both within and outside of the regions of supposed highest sulphur:
Of course there are many temperature records that do not exhibit this cyclical pattern, but I suggest that it is rather difficult to reproduce in many parts of the work without a common cause, whereas the stations that lack the pattern are perhaps more affected by urban growth, land use changes, or even changes to the station location or instrumentation itself.
Full post on it here: https://diggingintheclay.wordpress.com/2010/09/01/in-search-of-cooling-trends/
What you are suggesting is looking at the pattern in industrialised China where recent growth in coal consumption could be supposed to increase SO2 and result in the observed cooling (1970-2010). It certainly would be worth doing with groups of stations inside and outside the affected area to see if the temperatures tracked each other in earlier period and then began to diverge after industrialisation.
Pingback: How BEST to deal with cooling cities | Digging in the Clay