
OK time for a quick ‘spot the differences’ competition!
What are the differences between the two following images?


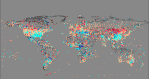
Now ‘Exhibit A’ on the left is from our very good friends at NCDC and ‘Exhibit B’ on the right is my replication of it. Besides the different sizes of each image and the red/grey colours used for the backgrounds on the charts and the chart and X/Y titles there aren’t an awful lot of differences are there? Well as Zeke H like to say why don’t you ’embiggen’ them and then you might spot some differences.
Notice how NCDC’s chart has lots of points that fall along the diagonal line of the chart whereas my replication doesn’t have that many. Here’s a tip for Matt Menne at NCDC. When you are ripping off and representing as your own replicating other people’s work, it’s often a good idea to make contact with them as that way, they may be able (and certainly will be willing) to help you avoid fairly obvious errors (that they previously made themselves as well but learned from their experiences and so avoided them second time around). In NCDC’s case they’ve include within their chart all the stations that have not undergone any adjustment to their raw data in GHCN v3 and so have a calculated adjusted trend that is exactly the same as the raw trend.
Now as is the tradition in climate science, Matt is going to say ‘well it doesn’t matter’ and as usual he’ll almost be right but of course not quite.
Matt Menne says in Slide 12 of his Exeter workshop presentation
“Outside of the USA ~60% of the GHCN V3 average temperature trends are larger following homogenisation.”
Well Matt some of us have known that homogenising (or adjusting or whatever word you wish to use to describe fiddling with) the raw data does indeed increase the ‘average temperature trends’ in the data. To use you chart, this means that a point on the chart appears in the ‘red’ background part of the chart as opposed to the ‘grey’ background part of the chart. By my calculations after you exclude all the stations that haven’t had their raw data adjusted (as you forgotten to do in your chart it would seem?) and also allow for the fact that a cooling station made more cool also constitutes an ‘increase’ in the ‘average temperature trend’ (from a negative trend to an even bigger negative trend) then I think you’ll find that the percentage of rest of the world stations i.e outside of the USA that are made ‘more warm’ (that were otherwise warming less or even cooling) as a result of homogenisation is more like 53%. See Matt all you needed to do was just get in touch and you could have avoided this error. Hey, you might even have been able to swing an invite for three ‘non traditional scientific sources (non peer reviewed)’ like Verity, TonyB and I, to the Exeter ‘jolly’. It would have been nice to meet you and even better TonyB could have told the attendees all about the inconvenient ‘Little Ice Age Thermometers’.
Now watch out for ‘Spot the Differences – Part 2’ coming soon in which I’ll be replicating NCDC Slides 19 and 20.
[see aslo previous post Don’t mention it – you’re welcome!]

Looks like there might be an “explanation” to this ridiculous conclusion. Maybe Verity, KevinUK and Anthony can help Matt rewrite his silly paper 😉
You are enjoying this way too much…
Sir, might we have more? 😉
I mentioned the surfacetemperatures.org workshop back in July. Did you make any attempt to contact the organisers to see if you could be invited? That’s what me and Nick did (and we paid our own expenses).
David,
my work diary was very full for that week and I would not have been in a position to take annual leave to go.
David
I don’t know so much about you, but Nick Barnes makes no secret about which side of the debate he sits.
http://bishophill.squarespace.com/blog/2010/9/3/the-climate-code-foundation.html
Whatever the laudable intentions of your new foundation the Met office would have viewed you as supportive of their position.
I am one of many who would be seen as having an alternative view to their consensus. They specifically said that the workshop was intended to draw in a wider range of alternative voices, but although myself- and many others- tried hard to get invites we did not succeed. Sceptics were as a result very poorly represented.
Incidentally I live 15 miles from the Met Office, offered to pay my own way and specialise in historic temperature data, so I do have something to contribute and would not have cost anyone a penny.
I think a great opportunity was missed to broaden the input to the process but now we will just view whatever the Met Office do in the future with suspicion because we know that their fine words are different to their actions.
tonyb