
A look at how urban areas might cool
Part 1 looked at the growth of various cities and urban areas and how that might cause UHI in the temperature record, which is likely to be a tangled mess of types of stations that all need to be treated slightly differently. How BEST to deal with cooling cities started to look at this issue but there’s plenty more to say.
BEST finds no statistically significant UHI effect but yet contradicts findings with words (see Muller’s problem with UHI, for example). The biggest issue is that there’s a real mix of urban stations – some warming and some cooling, and the same with rural stations. We know from the BEST dataset that ~30% of stations show cooling. Of course both NCDC and GISS use comparisons with surrounding stations to correct for urban warming – but if the surrounding ‘rural’ stations, which may be affected by land use change or rapid growth, are warming while the city is not this ‘rural’ warming trend is imparted to the city record also. The inherent thinking in their adjustments seems to be “Why would cities cool? This must be wrong.”
Oke (1983) suggests causes for UHI (Table 2, pg17), including “decreased evapotranspiration” due to reduced vegetation and an increase of impermeable surfaces. Rainfall runs off quickly and doesn’t hang around to increase evaporation. Even if there is minimal surface water, vegetation mobilises water from the subsurface and transpires it into the air as a means of self-regulating temperature. Put simply – vegetation cools. Apparently transpiration accounts for about 10 percent of the moisture in the atmosphere, with evaporation from bodies of water making up most of the other 90%. As the following set of maps show, the darker areas on the left hand image (areas with more vegetation) are cooler both by day and night. You can also see a reservoir, located at about 7 o’clock in each image, is cool during the day but warm at night.

Source of images: http://envstudies.brown.edu/reports/TreeReportForWebPrime.pdf
Increased greenery was being promoted by the source report for this figure as a way of cooling the city and mitigating the effects of climate change. Green roofs are another way – just don’t use them for siting weather stations – Thermal absorption – a black and green issue.
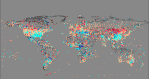
In arid areas, development brings vegetation and irrigation – take a look at the difference to Las Vegas in 25 years of growth – it has, literally, been blooming in the desert.

False-colour Landsat images of Las Vegas taken in 1984 and 2009 showing the increase in urban sprawl. [Vegetation – green, city – grey] Source: http://edition.cnn.com/SPECIALS/world/road-to-rio/satellite-photos-urban-sprawl/index.html
Young towns and cities grow…
A developer clears a patch of land of trees shrubs and tall grass and weeds. Roads and utilities are put in as housing plots are laid out. Houses are built, people move in. Neat lawns are sown, gardens are planted. Urban sprawl develops. We can imagine this land use change and infrastructure development would contribute to UHI, warming the city. As we saw in Part 1, growth of towns and cities has been rapid at some times, then slows down. How might this affect UHI and what happens when growth slows?
Site maturity
As I said “…lawns are sown, gardens are planted…” well, shrubs and trees grow. Typically they mature in 20-30 years – here’s the effect:

Suburb of Madison, Wisconsin (Image from Google Maps)
The green circled area on the left is ‘young housing’ with grass and the beginnings of gardens. The yellow area shows well-developed shrubs and developing trees, while the red area (top) has mature trees, providing shade. The change overall increases transpiration again. I keep thinking of all that rapid growth of towns and cities during the Baby Boomer years in the 50s. If this greening is what happens to suburban areas over 30 years, does this mitigate warming and even allow cooling? This IMHO is worth investigating, however challenging.
Overall this possibility means we can’t generalise and we can’t use population increase alone to correlate UHI, unless tree growth is ruled out. Once again we only get estimates. Perhaps the greening only offsets other urban development. The effect will be entirely different in warm/cool areas and dry/temperate/wet areas. It is likely in some areas, but here, again, is one of those issues that probably requires a lot of attention to detail of metadata – correct metadata. If there is an effect from the growth of ‘urban forest’ then we need to be careful WHEN we apply UHI corrections. How do we do that worldwide for historic data?
Chasing down UHI starts to become even more like looking for a needle in a haystack and it is easy to see why it is more convenient to say it doesn’t exit.
“I think China is one of the few places that are affected [by UHI]. The paper shows that London and Vienna (and also New York) are not affected in the 20th century.”
Phil Jones – email 1601.txt

I suspect that for most urban areas of the world, the neccessary data does not exist. Is it known if anyone is collecting data now on land being urbanised, so that in the future we might be able to draw some firmer conclusions?
“BEST finds no statistically significant UHI effect but yet contradicts findings with words”
As I recall, the finding was that there was no higher trend in urban temps compared with rural temps, but the interpretation was “little UHI effect”. Not the same thing at all.
Your linked page begins ‘According to the BEST findings, “urban warming does not unduly bias estimates of recent estimates of recent global temperature change”’. I take that to mean trends, not absolute temps, it says “recent estimates”, not necessarily long-term, and it says nothing about the reality or magnitude of UHI whatever.
Perhaps the wording was ambiguous (I think it is), perhaps it was meant to be (no kudos to Muller if that’s the case), perhaps some sceptics are prone to warmist interpretation, seeing what they want to see, and nothing more.
@Bloke down the pub
There seems to be little design in how and where weather stations are located – that is to say there are where they are for historic or practical reasons. However a few rural ones swallowed up by towns might now start to tell something in comparison to other neighbours.
@MostlyHarmless
Thanks for picking that up. My due dilligence isn’t what it used to be – if I have time to blog at all.
Hi Verity. In this post you are moving nearer to the heart of the matter: that land surface temperatures are a more a proxy for the hydrological cycle than the heat flux that measures the energy balance of the Earth. It is time to dump the temperature series of GISS, CRU, NCDC and BEST in the “trash basket” of history, along with their proponents, and move on to using the heat flux in water masses, as has been advocated by Pielke Sr for a long time and demonstrated by Bob Tisdale. The objections made that these are not homogenous and therefore suffer the same problems as land temperatures is not valid as it precisely the differences in heat exchange in the different ocean basins and their effects on land masses, either directly or through teleconnections, that makes up the climate zones. It is these zonal effects that are of importance and not some mythical global climate. Deployment of more Argo buoys to better sample the different ocean basins and the ocean currents that distribute the heat is what is needed, but if we need reference points these can be provided by the water masses in lakes. For example, David Archibald refers to how Lake Victoria in Africa responds to solar cycles that are at the heart of climate change:
You’re right – emphasising the role of water is important. It is probably something where we could and should be doing an awful lot more.
The 30% number is very misleading. when you compare long stations over the same period of time the number shrinks to 15%. Basically, in the chart you are referring to any station with more than 70 years of data was included. Those 70 years could have been 1900 to 1970 or
1930 to 2000. In any case when you compare long stations with good records ( no missing months ) the number of cooling stations falls even more and when you test for statistically meaningful cooling it falls even further. and when you identify stations that move from urban to rural locations.. well you get the idea